Dose-Dependent Elevation of the Blood NAD Metabolome by NR in Healthy Human Beings: Clinical Efficacy and Novel Diagnostic Biomarkers
Poster

Abstract
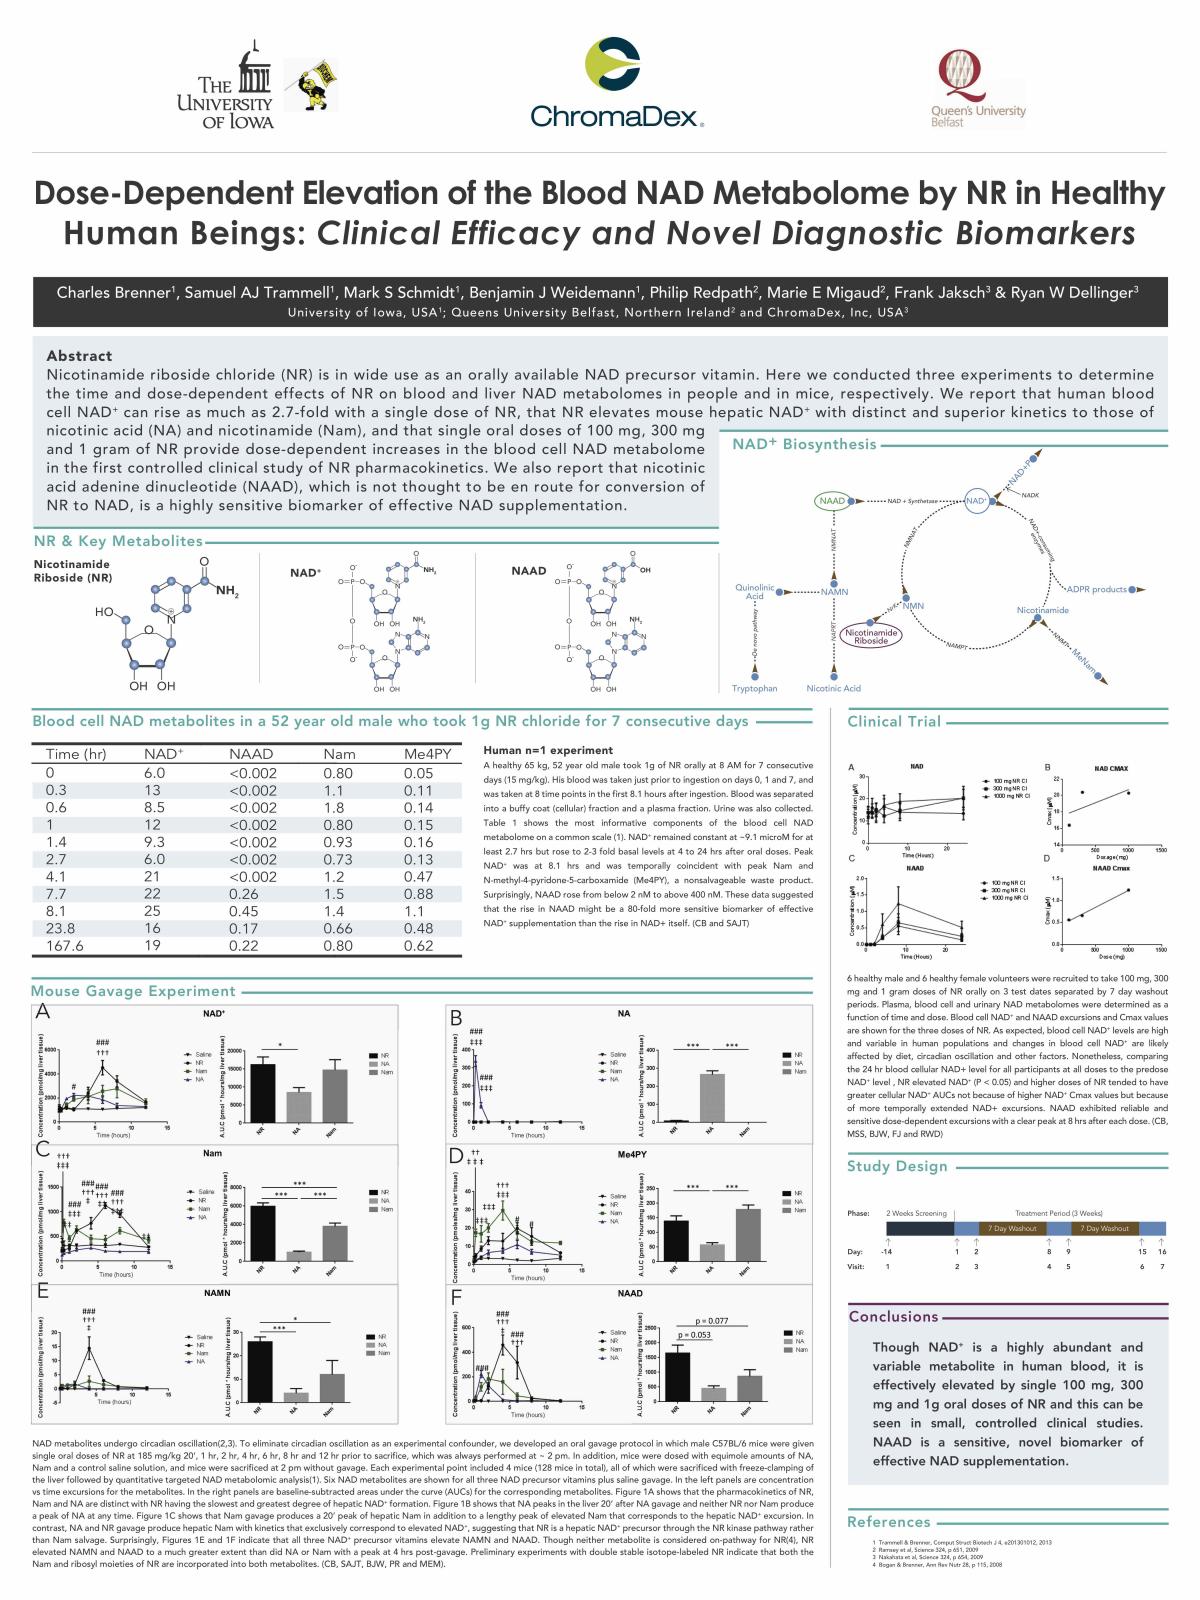
Nicotinamide riboside chloride (NR) is in wide use as an orally available NAD precursor vitamin. Here we conducted three experiments to determine the time and dose-dependent effects of NR on blood and liver NAD metabolomes in people and in mice, respectively. We report that human blood cell NAD+ can rise as much as 2.7-fold with a single dose of NR, that NR elevates mouse hepatic NAD+ with distinct and superior kinetics to those of nicotinic acid (NA) and nicotinamide (Nam), and that single oral doses of 100 mg, 300 mg and 1 gram of NR provide dose-dependent increases in the blood cell NAD metabolome in the first controlled clinical study of NR pharmacokinetics. We also report that nicotinic acid adenine dinucleotide (NAAD), which is not thought to be en route for conversion of NR to NAD, is a highly sensitive biomarker of effective NAD supplementation.
Human n=1 experiment
A healthy 65 kg, 52 year old male took 1g of NR orally at 8 AM for 7 consecutive days (15 mg/kg). His blood was taken just prior to ingestion on days 0, 1 and 7, and was taken at 8 time points in the first 8.1 hours after ingestion. Blood was separated into a buffy coat (cellular) fraction and a plasma fraction. Urine was also collected. Table 1 shows the most informative components of the blood cell NAD metabolome on a common scale (1). NAD+ remained constant at ~9.1 microM for at least 2.7 hrs but rose to 2-3 fold basal levels at 4 to 24 hrs after oral doses. Peak NAD+ was at 8.1 hrs and was temporally coincident with peak Nam and N-methyl-4-pyridone-5-carboxamide (Me4PY), a nonsalvageable waste product. Surprisingly, NAAD rose from below 2 nM to above 400 nM. These data suggested that the rise in NAAD might be a 80-fold more sensitive biomarker of effective NAD+ supplementation than the rise in NAD+ itself. (CB and SAJT)
6 healthy male and 6 healthy female volunteers were recruited to take 100 mg, 300 mg and 1 gram doses of NR orally on 3 test dates separated by 7 day washout periods. Plasma, blood cell and urinary NAD metabolomes were determined as a function of time and dose. Blood cell NAD+ and NAAD excursions and Cmax values are shown for the three doses of NR. As expected, blood cell NAD+ levels are high and variable in human populations and changes in blood cell NAD+ are likely affected by diet, circadian oscillation and other factors. Nonetheless, comparing the 24 hr blood cellular NAD+ level for all participants at all doses to the predose NAD+ level , NR elevated NAD+ (P < 0.05) and higher doses of NR tended to have greater cellular NAD+ AUCs not because of higher NAD+ Cmax values but because of more temporally extended NAD+ excursions. NAAD exhibited reliable and sensitive dose-dependent excursions with a clear peak at 8 hrs after each dose. (CB, MSS, BJW, FJ and RWD)
NAD metabolites undergo circadian oscillation(2,3). To eliminate circadian oscillation as an experimental confounder, we developed an oral gavage protocol in which male C57BL/6 mice were given single oral doses of NR at 185 mg/kg 20’, 1 hr, 2 hr, 4 hr, 6 hr, 8 hr and 12 hr prior to sacrifice, which was always performed at ~ 2 pm. In addition, mice were dosed with equimole amounts of NA, Nam and a control saline solution, and mice were sacrificed at 2 pm without gavage. Each experimental point included 4 mice (128 mice in total), all of which were sacrificed with freeze-clamping of the liver followed by quantitative targeted NAD metabolomic analysis(1). Six NAD metabolites are shown for all three NAD precursor vitamins plus saline gavage. In the left panels are concentration vs time excursions for the metabolites. In the right panels are baseline-subtracted areas under the curve (AUCs) for the corresponding metabolites. Figure 1A shows that the pharmacokinetics of NR, Nam and NA are distinct with NR having the slowest and greatest degree of hepatic NAD+ formation. Figure 1B shows that NA peaks in the liver 20’ after NA gavage and neither NR nor Nam produce a peak of NA at any time. Figure 1C shows that Nam gavage produces a 20’ peak of hepatic Nam in addition to a lengthy peak of elevated Nam that corresponds to the hepatic NAD+ excursion. In contrast, NA and NR gavage produce hepatic Nam with kinetics that exclusively correspond to elevated NAD+, suggesting that NR is a hepatic NAD+ precursor through the NR kinase pathway rather than Nam salvage. Surprisingly, Figures 1E and 1F indicate that all three NAD+ precursor vitamins elevate NAMN and NAAD. Though neither metabolite is considered on-pathway for NR(4), NR elevated NAMN and NAAD to a much greater extent than did NA or Nam with a peak at 4 hrs post-gavage. Preliminary experiments with double stable isotope-labeled NR indicate that both the Nam and ribosyl moieties of NR are incorporated into both metabolites. (CB, SAJT, BJW, PR and MEM).
Conclusions
Though NAD+ is a highly abundant and variable metabolite in human blood, it is effectively elevated by single 100 mg, 300 mg and 1g oral doses of NR and this can be seen in small, controlled clinical studies. NAAD is a sensitive, novel biomarker of effective NAD supplementation.
Edited by Bryan_S, 05 May 2016 - 12:23 AM.
text formatting


 This topic is locked


